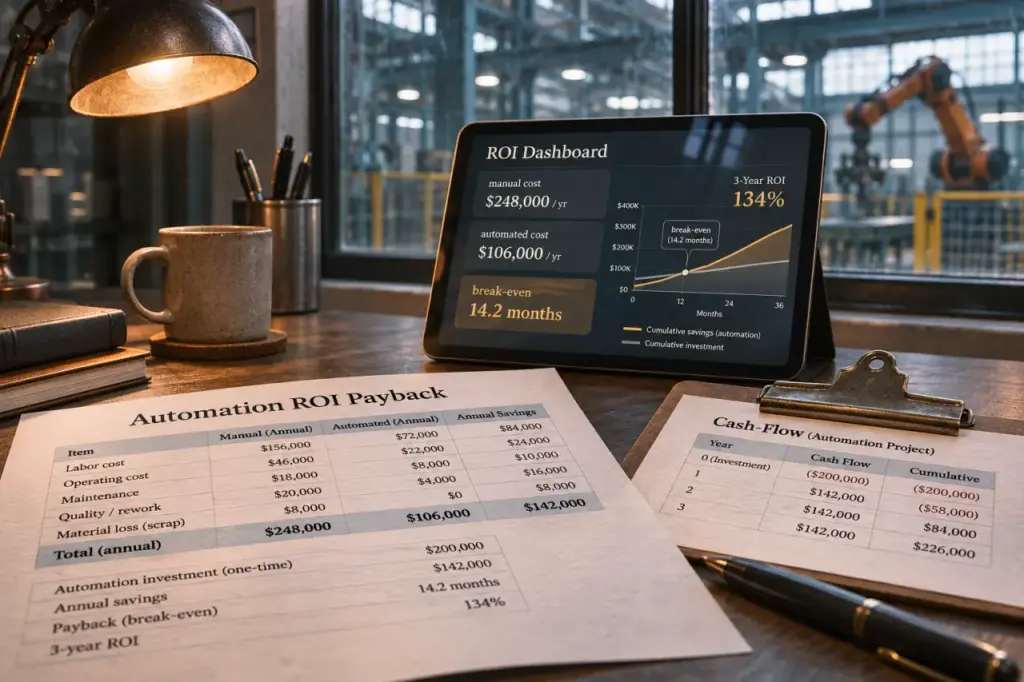
An automation investment makes financial sense only when projected savings exceed the full cost of implementation and operation. Use an automation ROI calculator to compare your current process with the cost of automating it, not just the purchase price. For industrial robotics or robotic process automation (RPA), focus on annual net savings, payback time, and cumulative cash impact.
Choose a calculator that matches the work
A manufacturing robot and an invoice-processing bot require different assumptions. Industrial robotics involves equipment, tooling, electricity, maintenance, and physical integration. RPA involves software subscriptions, workflow development, exception handling, and ongoing support. A calculator that overlooks these differences can produce an attractive but incomplete estimate.
- Industrial robotics: A3’s ROI Robot System Value Calculator includes purchase, maintenance, and electricity costs, with a 20-year comparison and year-by-year financial projections.
- Office process automation: Fortra’s RPA ROI Calculator focuses on manual processes, estimated savings, and time to positive ROI.
- Paint line automation: Graco offers an application-specific automation ROI tool for estimating potential savings.
Choose a calculator based on editable assumptions and transparent calculations, not its most impressive headline result. A spreadsheet is a practical alternative when an online tool cannot account for your operating schedule, retained labor, or implementation costs. In either case, make sure you can see which inputs drive the result.
Build a baseline from actual operating conditions
Start with one clearly defined process and use the same comparison period for manual and automated costs. Record the process location, task volume, staffing requirements, and operating schedule. Use a fully loaded hourly labor rate, including applicable employer costs, rather than wages alone. Location matters because labor rates, electricity tariffs, and operating costs vary.
| Input | What to enter |
|---|---|
| Labor | Workers per shift and fully loaded hourly cost |
| Schedule | Hours per shift, shifts per day, days per week, and operating weeks per year |
| Process volume | Transactions or units, handling time, and exception rate |
| Automation coverage | Work actually removed, plus supervision and manual tasks retained |
| Availability | Planned maintenance, downtime, and realistic utilization |
Annual manual labor cost = workers per shift × hourly labor rate × hours per shift × shifts per day × days per week × operating weeks. For RPA, transaction count multiplied by average manual handling time can provide a more useful baseline.
Trace the work to its root cause before assigning a value to automation. If employees repeatedly rekey orders because two systems do not exchange data, a direct integration may remove the task more cleanly than a bot. Map the trigger, handoffs, and exceptions first. Then compare automation with removing the underlying failure. Otherwise, the model may justify the cost of preserving an unnecessary process.
Separate released capacity from cash savings. Saving employee hours does not automatically reduce payroll. Track redeployed time separately unless it avoids overtime, hiring, contractor spending, or another measurable expense. This distinction helps prevent a business case from treating every hour saved as money removed from the budget.
Calculate ownership cost, savings, and payback separately
Upfront investment should include the purchase price or initial licensing, integration, programming, testing, training, and commissioning. For physical systems, include relevant tooling, safety measures, and facility changes. Recurring costs can include maintenance, electricity, subscriptions, support, retained labor, and exception handling.
Use these formulas for a simple, undiscounted model:
- Annual net savings: avoidable annual manual costs minus annual automated operating costs.
- Simple payback in years: upfront investment divided by annual net savings, when savings are positive.
- ROI over a chosen period: cumulative net savings minus upfront investment, divided by upfront investment, multiplied by 100.
- Effective hourly automation cost: total ownership cost over the chosen period divided by productive operating hours over that same period.
For example, assume avoidable manual costs of $80,000 per year, automated operating costs of $20,000 per year, and a $120,000 upfront investment. Annual net savings are $60,000, giving a simple payback of two years.
| Point in time | Annual net savings | Cumulative cash impact after investment |
|---|---|---|
| Installation | Not applicable | −$120,000 |
| End of year 1 | $60,000 | −$60,000 |
| End of year 2 | $60,000 | $0 |
| End of year 3 | $60,000 | $60,000 |
Three-year ROI is therefore 50%. This simplified example assumes immediate, steady savings and excludes financing, taxes, and discounting. If deployment takes time or savings vary, calculate the break-even point from cumulative cash flows rather than assuming a constant return from the start.
Stress-test the result before requesting approval
Run conservative, expected, and optimistic scenarios. Change utilization, implementation cost, retained staffing, and maintenance assumptions independently to see how each affects the result. More scheduled shifts improve the business case only when demand and process availability support productive operation.
A 20-year projection can help expose lifecycle costs, but it does not mean equipment, software, or demand will remain unchanged. Include replacements, upgrades, and changing operating costs where relevant. For a significant long-term investment, ask finance to assess discounted cash flows or net present value alongside the simple payback calculation.
Keep benefits from faster throughput, fewer errors, or reduced material waste separate until they can be measured. Do not count the same improvement twice. For example, avoid recording released hours as labor savings and also counting additional production made possible by using those same hours.
Before committing, validate technical feasibility with the process owner and implementation partner, obtain a scoped quote, and replace assumptions with pilot measurements. A positive calculator result supports further evaluation; it does not guarantee implementation results. Approve the project only when the costs, achievable savings, and downside scenario fit your investment criteria.
Questions to test before you trust the ROI result
Should the calculation use salary or fully loaded labour cost?
Use the fully loaded cost when possible. Salary alone leaves out employer contributions, benefits, recruitment, supervision and other costs attached to the manual process. Keep the assumptions visible so finance and operations can challenge them rather than treating the result as a promise.
What costs are easy to miss?
Integration, process redesign, training, testing, maintenance, licences, monitoring and temporary disruption can materially change payback. Include a contingency line instead of forcing every uncertainty into an optimistic base case.
How should uncertainty be handled?
Run at least three scenarios: conservative, expected and optimistic. Change transaction volume, adoption, error reduction and implementation cost one at a time. A project that works only in the optimistic case is not yet a robust business case.
What comes after a positive result?
Validate the process with a bounded pilot and measure the real baseline before rollout. The calculator should open a feasibility discussion, not replace technical discovery or a formal quote.